
Prometheus+Grafana监控体系
Prometheus+Grafana监控体系
这个监控由三个体系组成
-
相关exporter程序,负责通过http接口的形式将监听对象的状态信息暴露出来
也可以由应用本身暴露此接口,例如Spring的actuator开启后即会通过接口暴露Spring的各项指标信息
-
Prometheus收集上述点数据,并存储成时序数据
-
Grafana对监控数据进行图标展示
我们可以从Grafana Dashboard库中寻找别人做好的仪表盘,然后将其id复制到Grafana中即可,非常方便。
监控
Prometheus
-
后台启动
$ sudo nohup ./prometheus & -
访问相关地址查看
http://49.233.9.xxx:9090/targets -
修改配置文件后检查配置文件
$ ./promtool check config prometheus.yml -
修改配置文件后重启
$ sudo kill -hup 6580注意:
建议采用此种方式(kill -hup)重启,此种方式下,当你的配置出错的时候,不会重新加载错误的配置部分,也不会造成服务停止。
当然,最好还是使用promtool在重启前检查一下配置。
配置文件说明
# 全局配置
global:
# 采集被监控端的一个周期,默认是1分钟
scrape_interval: 15s
# 告警的评估周期,默认是1分钟
# Evaluate rules every 15 seconds. The default is every 1 minute.
evaluation_interval: 15s
# 服务发现
# A scrape configuration containing exactly one endpoint to scrape:
scrape_configs:
# The job name is added as a label `job=<job_name>` to any timeseries scraped from this config.
- job_name: 'prometheus'
# metrics_path defaults to '/metrics'
# scheme defaults to 'http'.
# 静态配置为一种简单的配置方式
static_configs:
- targets: ['localhost:9090']
# 用于解决prometheus server的label与exporter端用户自定义label冲突的问题
# true: 同名的标签以被采集的标签为准, 忽略服务端本地标签
# false: 默认值,同名的被采集的标签将不会覆盖服务端本地标签,而是标签名前增加exported_而服务端本地标签保留
honor_labels: true
- job_name: 'openapi'
# How frequently to scrape targets from this job.
# [ scrape_interval: <duration> | default = <global_config.scrape_interval> ]
metrics_path: '/openapi/actuator/prometheus'
scrape_interval: '5s'
static_configs:
- targets: ['172.27.16.xxx:9091', '172.27.0.26:9091']
#可以定义一些自己的标签
labels:
application: 'openapi'
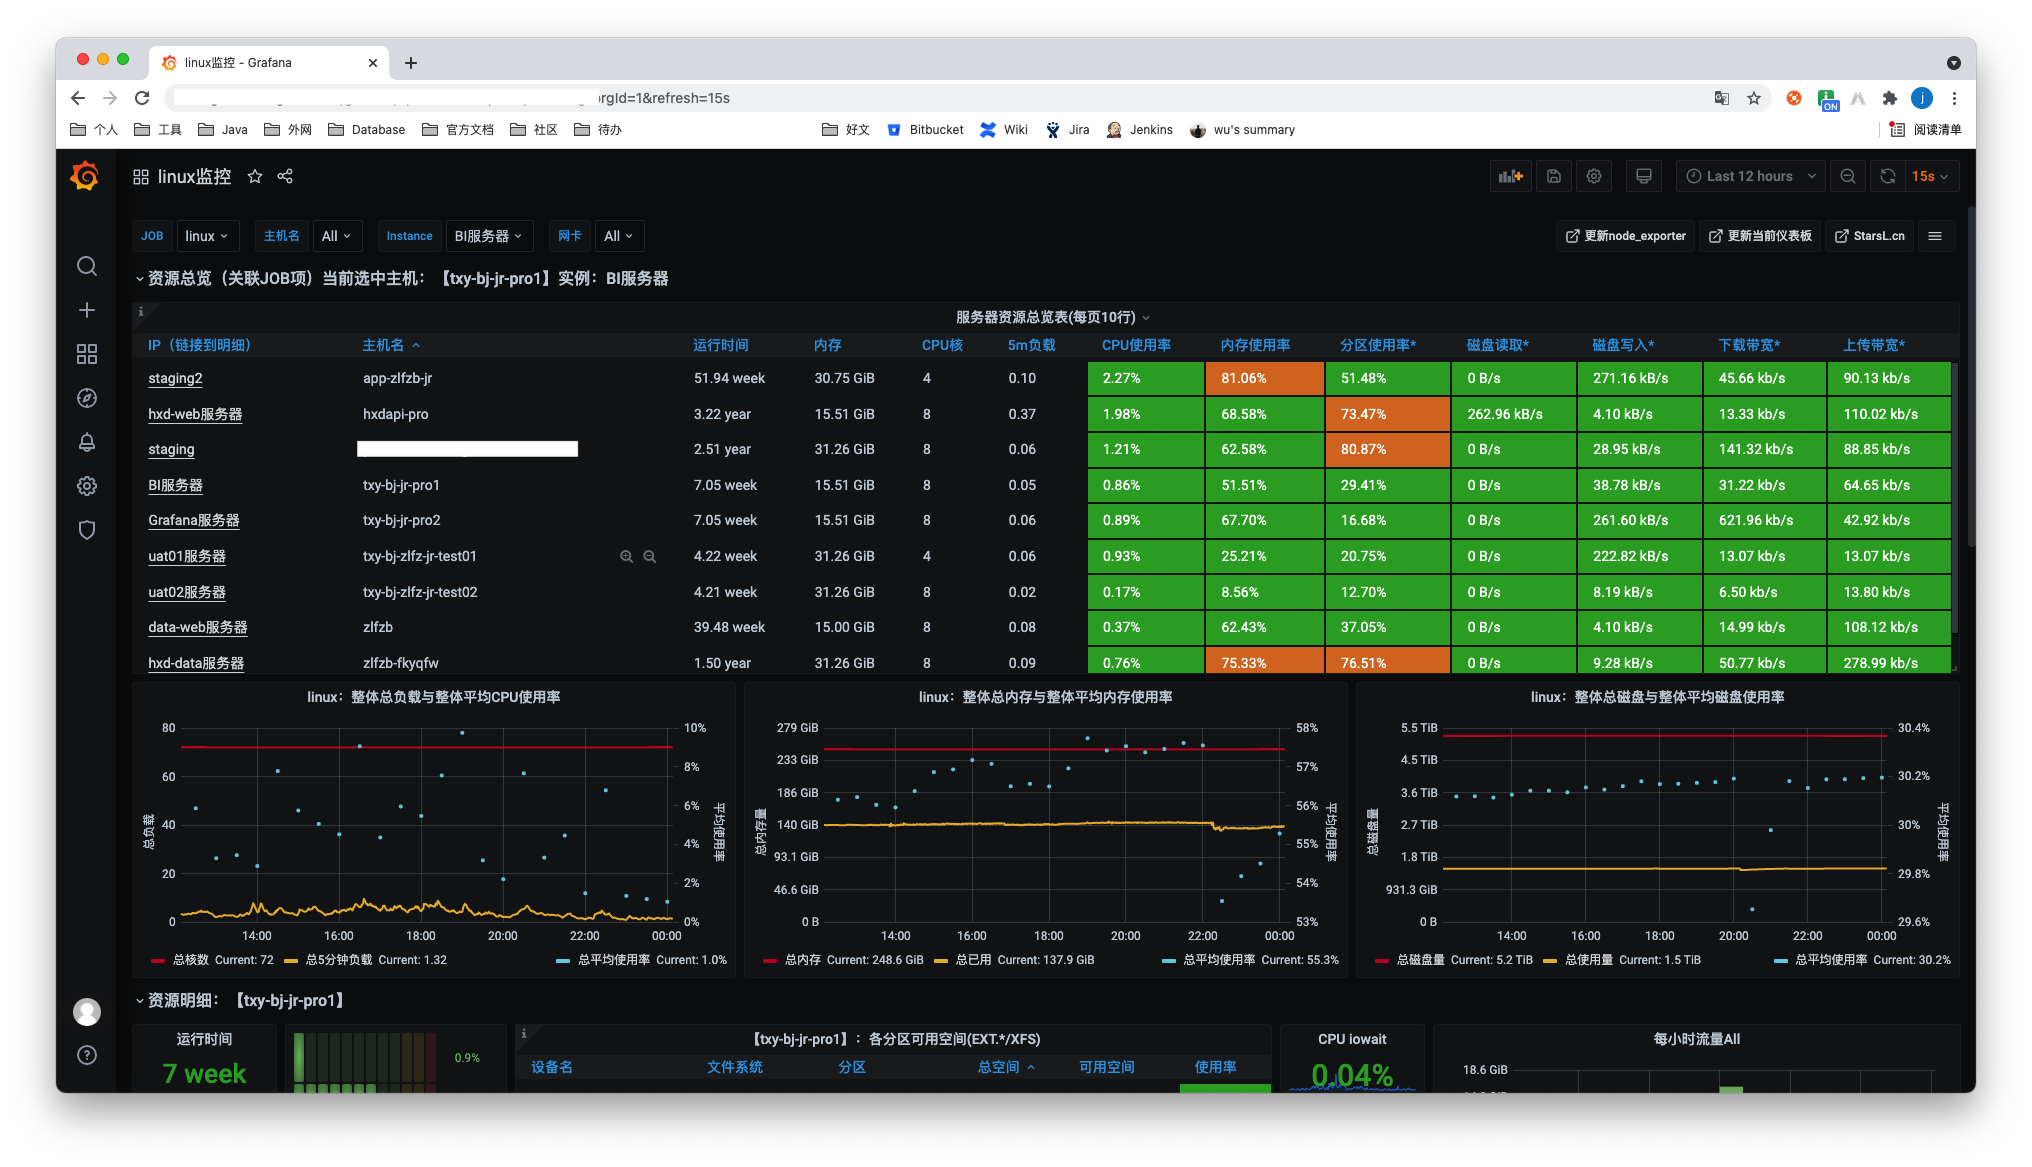
- job_name: 'linux'
static_configs:
- targets: ['172.16.120.xxx:9100']
labels:
instance: staging2
- targets: ['172.16.180.xxx:10100']
labels:
instance: staging
注意:
要想配置多个targer:也可采用如下方式:
static_configs:
- targets: ['192.168.x.x:9100']
- targets: ['192.168.x.y:9100']
- targets: ['192.168.x.z:9100']
Linux
-
安装node_exporter
$ node_exporter-1.1.2.linux-amd64.tar.gz -
启动node_exporter
$ node_exporter: $nohup ./node_exporter &默认为9100端口,也可指定端口启动
$ nohup ./node_exporter --web.listen-address=":10100" & -
ip+端口访问,查看存在信息
-
修改prometheus配置文件
scrape_configs: - job_name: 'linux' static_configs: - targets: ['172.16.120.xxx:9100'] labels: instance: staging2 - targets: ['172.16.180.xxx:10100'] labels: instance: staging -
重启Prometheus
-
在Grafana的数据源配置为prometheus,在Grafana Dashboards选择一个Dashboards即可
Springboot
-
导入spring-boot-starter-actuator依赖,并且增加micrometer-registry-prometheus的依赖,将原本的监控指标输出成prometheus的格式
gradle
compile group: 'org.springframework.boot', name: 'spring-boot-starter-actuator', version: '2.1.6.RELEASE'
implementation group: 'io.micrometer', name: 'micrometer-registry-prometheus', version: '1.6.5'
maven
<dependency> <groupId>org.springframework.boot</groupId> <artifactId>spring-boot-starter-actuator</artifactId> </dependency> <dependency> <groupId>io.micrometer</groupId> <artifactId>micrometer-registry-prometheus</artifactId> <scope>runtime</scope> </dependency> -
增加springboot的配置文件
#actuator配置 management: endpoints: web: exposure: include: prometheus -
访问相应连接访问
xxx/actuator/prometheus可以看到如下指标:
# HELP tomcat_sessions_alive_max_seconds # TYPE tomcat_sessions_alive_max_seconds gauge tomcat_sessions_alive_max_seconds 0.0 # HELP tomcat_servlet_error_total # TYPE tomcat_servlet_error_total counter tomcat_servlet_error_total{name="default",} 0.0 tomcat_servlet_error_total{name="jsp",} 0.0 tomcat_servlet_error_total{name="dispatcherServlet",} 21.0 # HELP hikaricp_connections_timeout_total Connection timeout total count # TYPE hikaricp_connections_timeout_total counter hikaricp_connections_timeout_total{pool="HikariPool-1",} 0.0 hikaricp_connections_timeout_total{pool="HikariPool-2",} 0.0 hikaricp_connections_timeout_total{pool="HikariPool-3",} 0.0 # TYPE jvm_memory_max_bytes gauge jvm_memory_max_bytes{area="heap",id="PS Survivor Space",} 1.1010048E7 jvm_memory_max_bytes{area="heap",id="PS Old Gen",} 2.776629248E9 jvm_memory_max_bytes{area="heap",id="PS Eden Space",} 1.325400064E9 jvm_memory_max_bytes{area="nonheap",id="Metaspace",} -1.0 jvm_memory_max_bytes{area="nonheap",id="Code Cache",} 2.5165824E8 jvm_memory_max_bytes{area="nonheap",id="Compressed Class Space",} 1.073741824E9 ... -
修改prometheus配置文件,可以新增一个job,不同的jobname即可
scrape_configs: - job_name: 'openapi' metrics_path: '/openapi/actuator/prometheus' scrape_interval: '5s' static_configs: - targets: ['172.27.16.xxx:9091'] labels: application: 'openapi' -
同样在Grafana上找一个Spring的dashboard id,数据源选择prometheus即可,可以采用如下:
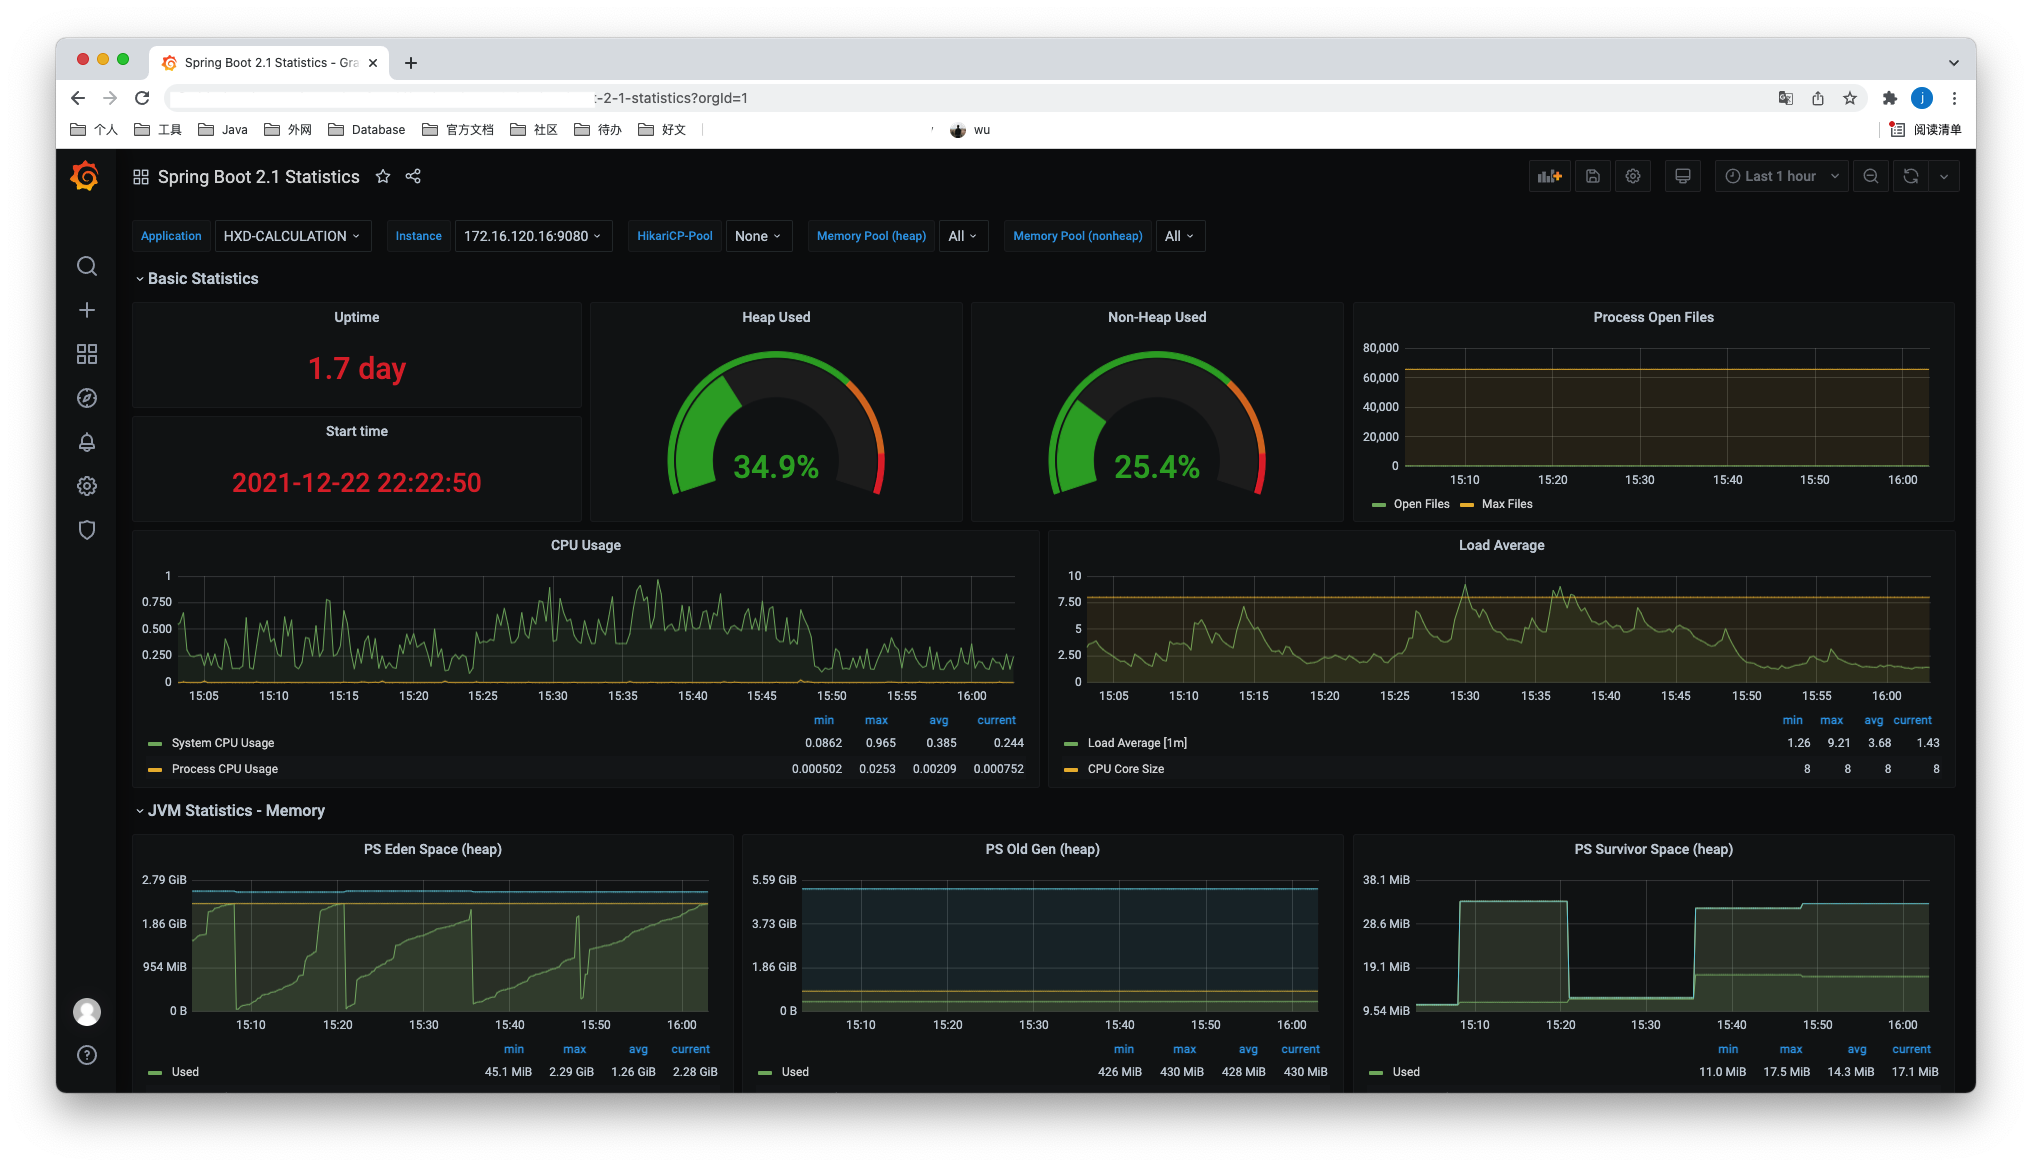
注意:
-
Spring Boot 2.0.4.RELEASE/2.0.3.RELEASE版本使用Prometheus,访问
actuator/prometheus,会出现406的情况,解决方法如下:https://stackoverflow.com/questions/51496648/cant-get-prometheus-to-work-with-spring-boot-2-0-3
-
Spring Boot 2.0.4.RELEASE版本,Prometheus有数据,但是面板无数据
由于面板筛选变量instance的表达式为
label_values(jvm_classes_loaded_classes{application="$application"}, instance),jvm_classes_loaded_classes指标在该版本的名字为jvm_classes_loaded,将instance变量的表达式修改为共有变量process_uptime_seconds,即label_values(process_uptime_seconds{application="$application"}, instance)。
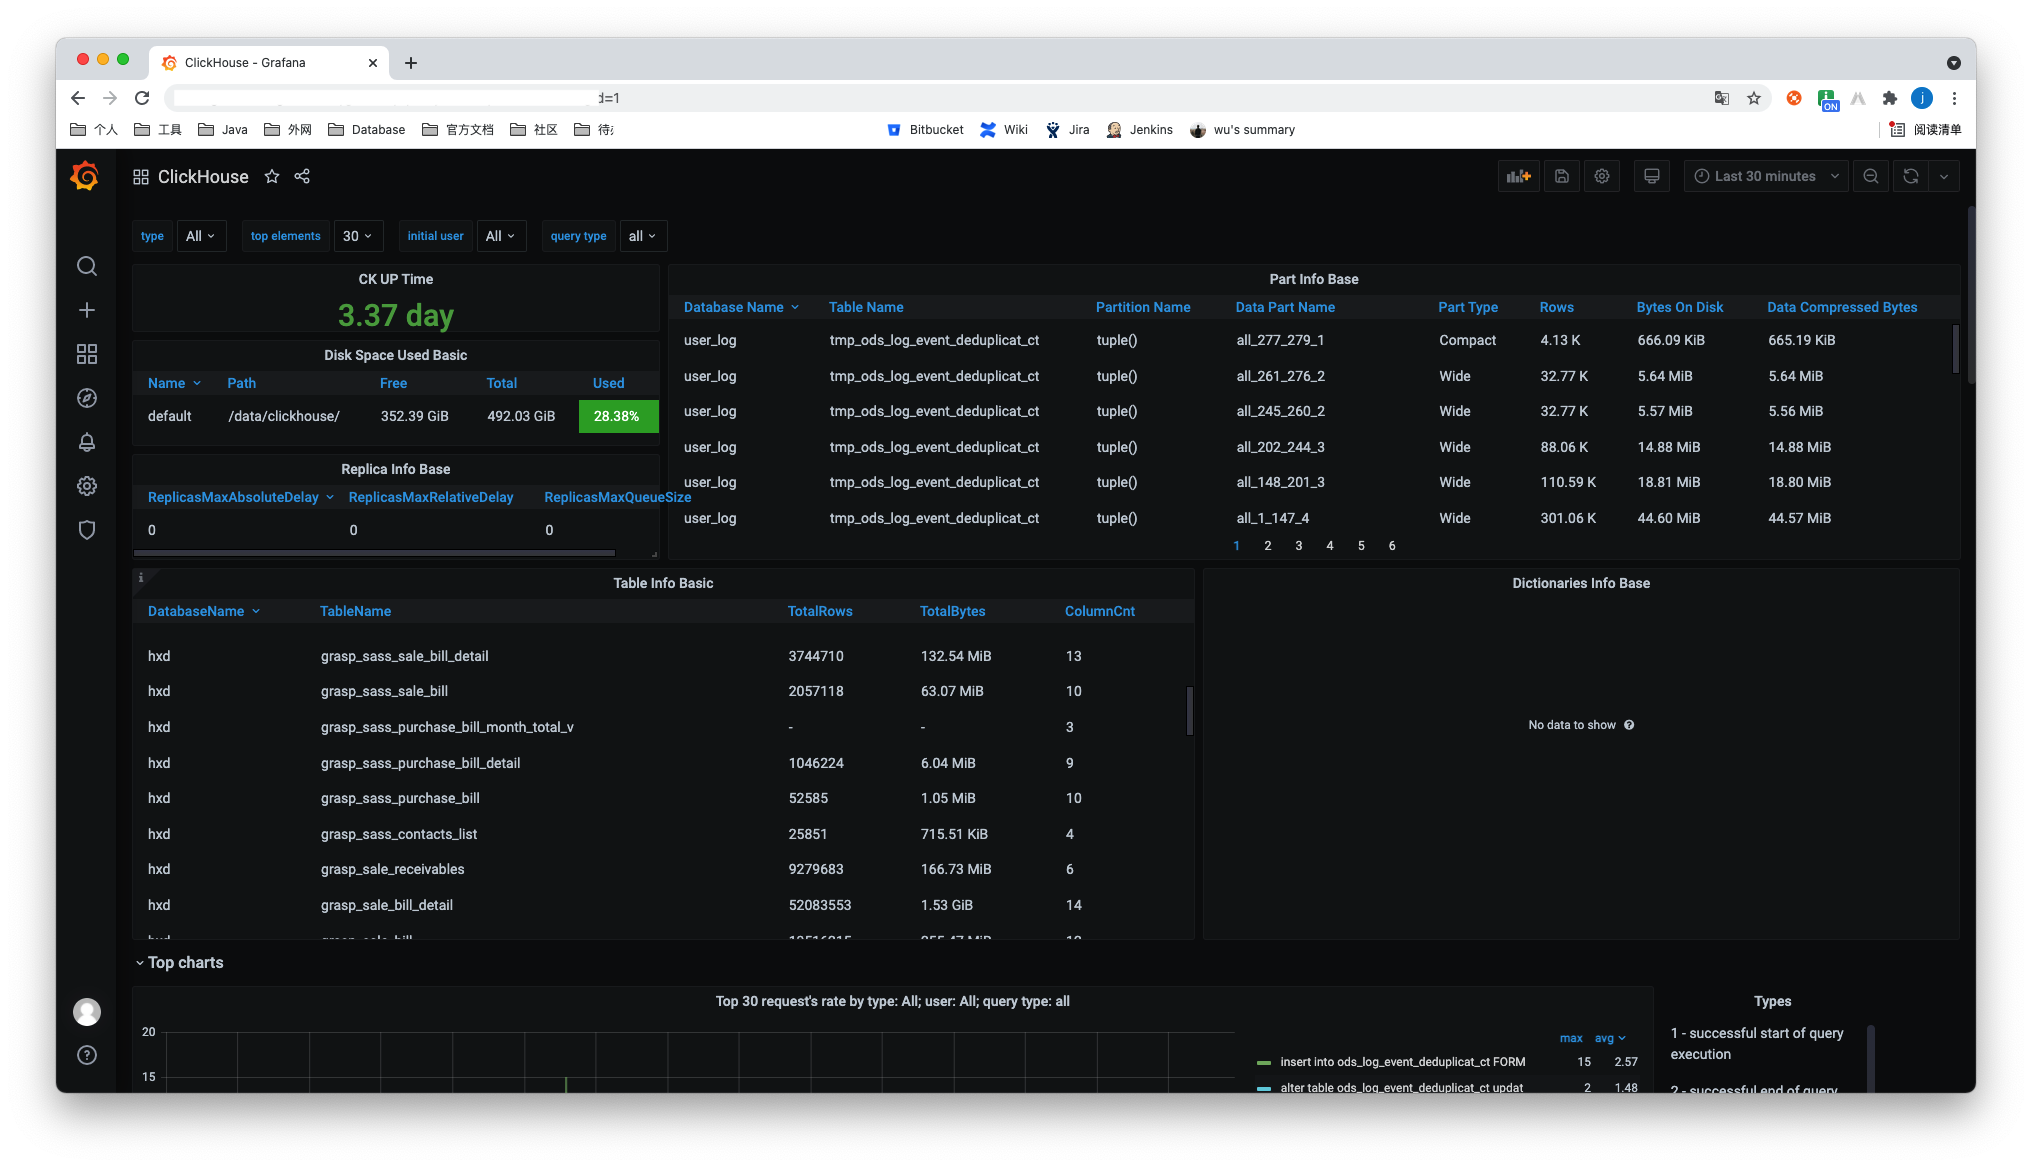
ClickHouse
- Grafana下载ClickHouse插件
- 在Grafana添加ClickHouse的数据源
- 选择一个使用ClickHouse数据源的dashboard即可
最终如下:
Mysql
-
上传、解压
$ sudo tar -xvf mysqld_exporter-0.13.0.linux-amd64.tar.gz -
登录mysql为exporter创建账号并授权
CREATE USER 'exporter'@'localhost' IDENTIFIED BY 'XXXXXXXX' WITH MAX_USER_CONNECTIONS 3; GRANT PROCESS, REPLICATION CLIENT, SELECT ON *.* TO 'exporter'@'localhost'; -
创建文件
.my.cnf[client] user=exporter password=xxxxxxx注意:
- 此处可能存在密码中有些字符无法识别的问题,即时观察日志输出
-
运行
$ nohup ./mysqld_exporter --config.my-cnf=.my.cnf & -
访问端口测试
http://xxxxxxxx:9104/ -
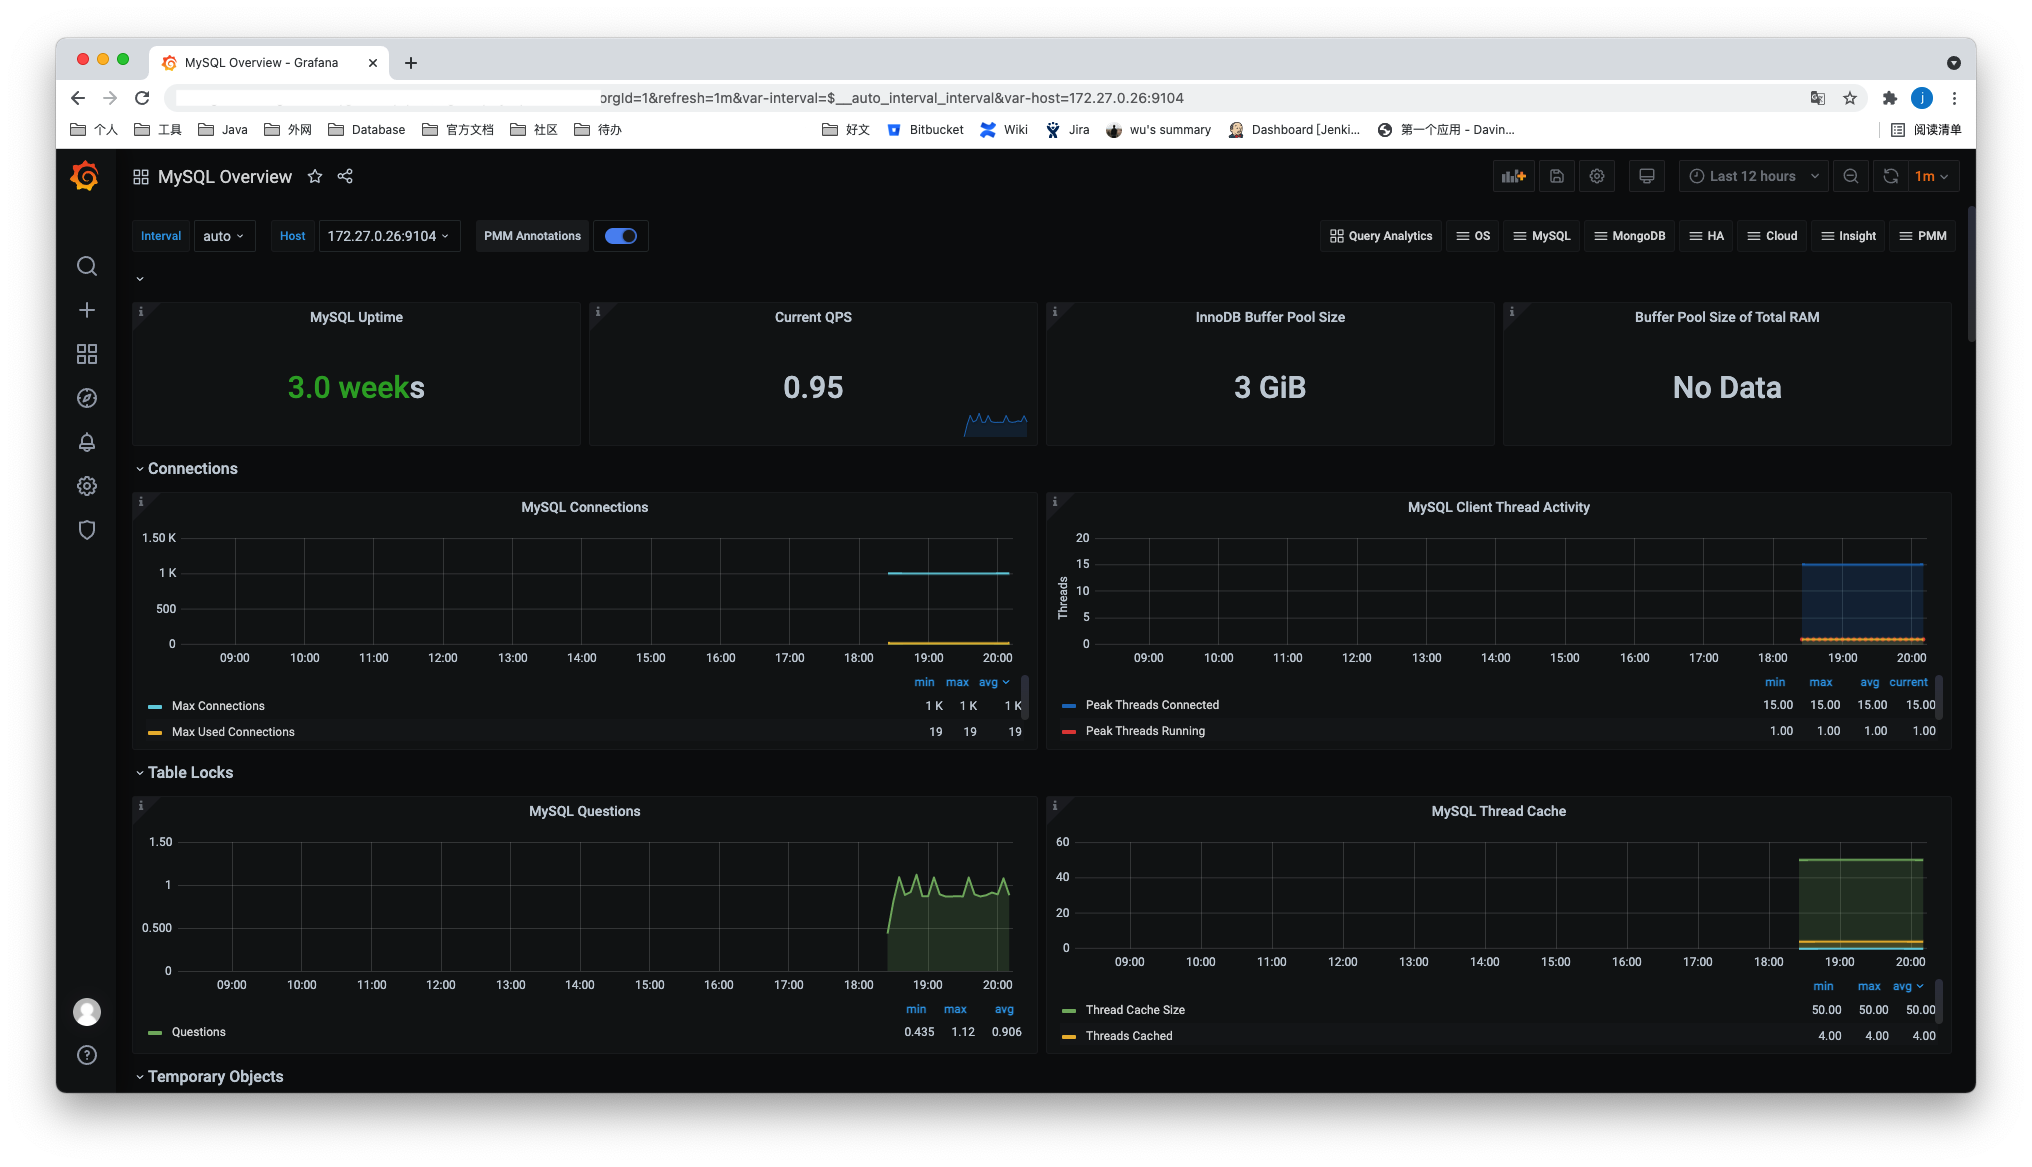
修改prometheus.yml添加job
- job_name: "mysql" static_configs: - targets: ["172.16.74.xxx:9104", "172.27.0.xxx:9104"] honor_labels: true -
重启prometheus
效果如图:
预警
prometheus告警状态
-
Inactive
-
Pending
已触发阈值,但未满足告警持续时间(即rule中的for字段)
-
Firing
已触发阈值且满足告警持续时间。警报发送到Notification Pipeline,经过处理,发送给接受者这样目的是多次判断失败才发告警,减少邮件。
alertmanager
管理页面
xxx:9093
可以在此页面对某个告警进行silence。
配置
alertmanager.yml
route:
  #采用哪个标签进行分组
  group_by: ['alertname']
  #最初等待多久发送一组报警
  group_wait: 30s
  #发送不报警前的等待时间
  group_interval: 5m
  #发送重复报警的周期
  repeat_interval: 1h
  receiver: 'email'
receivers:
- name: 'email'
  email_configs:
  - to: '[email protected]'
inhibit_rules:
  - source_match:
      severity: 'critical'
    target_match:
      severity: 'warning'
    equal: ['alertname', 'dev', 'instance']

global:
  #声明警告被解决的时间,如果警报没有再次发送
  resolve_timeout: 5m #处理超时时间,默认为5min
  smtp_smarthost: 'smtp.exmail.qq.com:587' # 邮箱smtp服务器代理
  smtp_from: '[email protected]' # 发送邮箱名称
  smtp_auth_username: '[email protected]' # 邮箱名称
  smtp_auth_password: 'xxxxx' #邮箱密码
  smtp_require_tls: true
global 全局配置
-
resolve_timeoutResolveTimeout is the default value used by alertmanager if the alert does not include EndsAt, after this time passes it can declare the alert as resolved if it has not been updated.
This has no impact on alerts from Prometheus, as they always include EndsAt.
route
-
group_by -
group_waitHow long to initially wait to send a notification for a group of alerts. Allows to wait for an inhibiting alert to arrive or collect more initial alerts for the same group. (Usually ~0s to few minutes.)
-
group_intervalHow long to wait before sending a notification about new alerts that are added to a group of alerts for which an initial notification has already been sent. (Usually ~5m or more.)
举例
# 子route会继承所有根root未被重写的参数
route:
  receiver: 'default-receiver'
  group_wait: 30s
  group_interval: 5m
  repeat_interval: 4h
  group_by: [cluster, alertname]
  # 所有不匹配下面子route的都会留在根root并匹配default-receiver
  routes:
  # sevice等于mysql或cassandra的分配到atabase-pager
  - receiver: 'database-pager'
    group_wait: 10s
    matchers:
    - service=~"mysql|cassandra"
  # All alerts with the team=frontend label match this sub-route.
  # They are grouped by product and environment rather than cluster
  # and alertname.
  - receiver: 'frontend-pager'
    group_by: [product, environment]
    matchers:
    - team="frontend"
inhibit_rules这个叫做抑制项,通过匹配源告警来抑制目的告警。
prometheus.yml
在prometheus.yml中添加如下配置:
# 匹配的规则文件,会依次读取
rule_files:
  - "rules/*.yml"
  # - "first_rules.yml"
  # - "second_rules.yml"

# Alertmanager configuration
alerting:
  alertmanagers:
  - static_configs:
    - targets:
       - 127.0.0.1:9093
并新增规则配置:
# 报警规则的名称
# The name of the alert. Must be a valid label value.
alert: <string>

# The PromQL expression to evaluate. Every evaluation cycle this is
# evaluated at the current time, and all resultant time series become
# pending/firing alerts.
expr: <string>

# 评估等待时间,可选参数。用于表示只有当触发条件持续一段时间后才发送告警。在等待期间新产生告警的状态为pending
# Alerts are considered firing once they have been returned for this long.
# Alerts which have not yet fired for long enough are considered pending.
[ for: <duration> | default = 0s ]

# Labels to add or overwrite for each alert.
# 自定义标签,允许用户指定要附加到告警上的一组附加标签。··
labels:
  [ <labelname>: <tmpl_string> ]

# Annotations to add to each alert.
# 用于指定一组附加信息,比如用于描述告警详细信息的文字等,annotations的内容在告警产生时会一同作为参数发送到Alertmanager。summary描述告警的概要信息,description用于描述告警的详细信息。同时Alertmanager的UI也会根据这两个标签值,显示告警信息。
annotations:
  [ <labelname>: <tmpl_string> ]
格式检查:
promtool check rules /path/to/example.rules.yml
References
- prometheus官方文档:prometheus configuration
- Stack Overflow:Can't get Prometheus to work with Spring Boot 2.0.3
- 博客:SpringBoot集成cas-client 客户端配置拦截过滤,绝对最简单有效,亲测
评论 (0)
登录后即可发表评论